| July 2021: Aerial imagery from UAS surveys of beaches at Fort Stevens State Park, OR, and Cape Disappointment State Park, WA |
Structure from Motion - UAS |
This portion of the data release presents the raw aerial imagery collected during the uncrewed aerial system (UAS) survey conducted on the ocean beaches adjacent to the Columbia River Mouth at the Oregon-Washington border in July 2021. The imagery was acquired using a Department of Interior-owned 3DR Solo quadcopter fitted with a Ricoh GR II digital camera featuring a global shutter. The camera was mounted using a fixed mount on the bottom of the UAS and oriented in an approximately nadir orientation. The Fort Stevens State Park survey was conducted under Oregon Parks and Recreation Department Scientific Research Permit #235. Ten flights were conducted at Fort Stevens State Park on 22 July 2021, between 14:00 and 16:45 UTC (7:00 and 9:45 PDT). A total of 3,002 aerial images from these flights are presented in this data release, the images from the third flight (F03) were not utilized for data processing and are not included in the data release. The Benson Beach survey at Cape Disappointment State Park was conducted under Washington State Parks and Recreation Commission Scientific Research Permit #170603. Thirteen flights were conducted at Benson Beach on 23 July 2021, between 14:30 and 16:40 UTC (7:30 and 9:40 PDT). A total of 3,648 aerial images from these flights are presented in this data release, the images from the second to the fifth flight (F02 through F05) and the seventh flight (F07) were not utilized for data processing and are not included in the data release. All flights were conducted at an approximate altitude of 120 meters above ground level resulting in a nominal ground-sample-distance (GSD) of 3.2 centimeters per pixel. Before each flight, the camera’s digital ISO, aperture, and shutter speed were adjusted for ambient light conditions. For all flights the camera was triggered at 1 Hz using a built-in intervalometer. After acquisition, the images were renamed to include flight number and acquisition time in the file name. The coordinates of the approximate image acquisition locations were added ('geotagged') to the image metadata (EXIF) using the telemetry log from the UAS onboard single-frequency autonomous GPS. The image EXIF were also updated to include additional information related to the acquisition. The data release includes a total of 6,650 JPG images. Images from takeoff and landing sequences were not used for processing and have been omitted from the data release. To facilitate bulk download, the images from each flight are provided in a zip file named with the flight number. In addition to the provided zip files, the images are also available for browsing and individual download on the USGS Coastal and Marine Hazards and Resources Program Imagery Data System at the following URL: https://cmgds.marine.usgs.gov/idsviewer/data_release/10.5066-P9BVTVAW. |
Joshua Logan |
| July 2021: Digital Surface Models (DSM) from UAS surveys of the beaches at Fort Stevens State Park, OR, and Cape Disappointment State Park, WA |
Structure from Motion - UAS |
This portion of the data release presents digital surface models (DSM) of the ocean beach at Fort Stevens State Park, OR, and Benson Beach at Cape Disappointment State Park, WA. The DSMs have resolutions of 10 centimeters per pixel and were derived from structure-from-motion (SfM) processing of aerial imagery collected with unoccupied aerial systems (UAS) during low tides on 22 and 23 July 2021. Unlike a digital elevation model (DEM), the DSMs represent the elevation of the highest object within the bounds of a cell. Vegetation, buildings, and other objects have not been removed from the data. The raw imagery used to create the DSMs was acquired with a UAS fitted with a Ricoh GR II digital camera featuring a global shutter. The UAS was flown on pre-programmed autonomous flight lines spaced to provide approximately 70 percent overlap between images from adjacent lines. The camera was triggered at 1 Hz using a built-in intervalometer. The UAS was flown at an approximate altitude of 120 meters above ground level (AGL), resulting in a nominal ground-sample-distance (GSD) of 3.2 centimeters per pixel. The raw imagery was geotagged using positions from the UAS onboard single-frequency autonomous GPS. Survey control was established using temporary ground control points (GCPs) consisting of a combination of small square tarps with black-and-white cross patterns and temporary chalk marks placed on the ground. The GCP positions were measured using dual-frequency post-processed kinematic (PPK) GPS with corrections referenced to a static base station operating nearby. The images and GCP positions were used for structure-from-motion (SfM) processing to create topographic point clouds, high-resolution orthomosaic images, and DSMs. The DSMs, which are presented in this portion of the data release have been formatted as cloud optimized GeoTIFFs with internal overviews and masks to facilitate cloud-based queries and display. |
Joshua Logan |
| July 2021: Ground control point locations for UAS surveys of the beaches at Fort Stevens State Park, OR, and Cape Disappointment State Park, WA |
Structure from Motion - UAS |
This portion of the data release presents the locations of the temporary ground control points (GCPs) used for the structure-from-motion (SfM) processing of the imagery collected during the July 2021 unoccupied aerial system (UAS) surveys of the ocean beach at Fort Stevens State Park, OR, and Benson Beach at Cape Disappointment State Park, WA. Eighteen temporary ground control points (GCPs) were distributed throughout the survey area to establish survey control. The GCPs consisted of a combination of small square tarps with black-and-white cross patterns and "X" marks placed on the ground using temporary chalk. The GCP positions were measured using dual-frequency post-processed kinematic (PPK) GPS with corrections referenced to a static base station operating nearby. The GCP positions are presented in a comma-delimited text file. |
Joshua Logan |
| July 2021: Orthomosaic images from UAS surveys of the beaches at Fort Stevens State Park, OR, and Cape Disappointment State Park, WA |
Structure from Motion - UAS |
This portion of the data release presents high-resolution orthomosaic images of the ocean beach at Fort Stevens State Park, OR, and Benson Beach at Cape Disappointment State Park, WA. The orthomosaics have resolutions of 5 centimeters per pixel and were derived from structure-from-motion (SfM) processing of aerial imagery collected with unoccupied aerial systems (UAS) during low tide surveys on 22 and 23 July 2021. The raw imagery used to create the orthomosaics was acquired with a UAS fitted with a Ricoh GR II digital camera featuring a global shutter. The UAS was flown on pre-programmed autonomous flight lines spaced to provide approximately 70 percent overlap between images from adjacent lines. The camera was triggered at 1 Hz using a built-in intervalometer. The UAS was flown at an approximate altitude of 120 meters above ground level (AGL), resulting in a nominal ground-sample-distance (GSD) of 3.2 centimeters per pixel. The raw imagery was geotagged using positions from the UAS onboard single-frequency autonomous GPS. Survey control was established using temporary ground control points (GCPs) consisting of a combination of small square tarps with black-and-white cross patterns and temporary chalk marks placed on the ground. The GCP positions were measured using dual-frequency post-processed kinematic (PPK) GPS with corrections referenced to a static base station operating nearby. The images and GCP positions were used for structure-from-motion (SfM) processing to create topographic point clouds, high-resolution orthomosaic images, and DSMs. The orthomosaic images have been provided in a three-band RGB format, with 8-bit unsigned integer values compressed using high-quality JPEG compression and are formatted as cloud optimized GeoTIFFs with internal overviews and masks to facilitate cloud-based queries and display. |
Joshua Logan |
| July 2021: Topographic point clouds from UAS surveys of the beaches at Fort Stevens State Park, OR, and Cape Disappointment State Park, WA |
Structure from Motion - UAS |
This portion of the data release presents topographic point clouds of the ocean beach at Fort Stevens State Park, OR, and Benson Beach at Cape Disappointment State Park, WA. The point clouds were derived from structure-from-motion (SfM) processing of aerial imagery collected with unoccupied aerial systems (UAS) on 2017-11-01 during low tide surveys on 22 and 23 July 2021. The point clouds from each survey are tiled into 500 by 500 meter tiles to reduce individual file sizes. The Fort Stevens point clouds have a total of approximately 496 million points, with an average point density of 386 points per-square meter and an average point spacing of 5 centimeters. The Benson Beach point clouds have a total of approximately 476 million points, with an average point density of 363 points per-square meter and an average point spacing of 5 centimeters. Each point in the point clouds contains explicit horizontal and vertical coordinates, color, and point class (either 0 [unclassified] or 7 [noise]). In addition, each point has a confidence value (calculated by Agisoft Metashape during point cloud creation) stored as an extra byte. The point confidence value was used to identify and classify erroneous points likely resulting from poor surface reconstruction due to water, vegetation, or areas of uniform surface texture (such as sand of uniform color). All points with confidence less than 4 have been classified as class 7 (noise). All other points have been left unclassified (class 0). Some areas of noise resulting from poor terrain reconstruction may remain unclassified in the point clouds. The raw imagery used to create the point clouds was acquired with a UAS fitted with a Ricoh GR II digital camera featuring a global shutter. The UAS was flown on pre-programmed autonomous flight lines spaced to provide approximately 70 percent overlap between images from adjacent lines. The camera was triggered at 1 Hz using a built-in intervalometer. The UAS was flown at an approximate altitude of 120 meters above ground level (AGL), resulting in a nominal ground-sample-distance (GSD) of 3.2 centimeters per pixel. The raw imagery was geotagged using positions from the UAS onboard single-frequency autonomous GPS. Survey control was established using temporary ground control points (GCPs) consisting of a combination of small square tarps with black-and-white cross patterns and temporary chalk marks placed on the ground. The GCP positions were measured using dual-frequency post-processed kinematic (PPK) GPS with corrections referenced to a static base station operating nearby. The images and GCP positions were used for structure-from-motion (SfM) processing to create topographic point clouds, high-resolution orthomosaic images, and DSMs. The point clouds are formatted in LAZ format (LAS 1.2 specification). |
Joshua Logan |
| Nearshore bathymetry of the Columbia River littoral cell, Washington and Oregon, 2021 |
Waverunners |
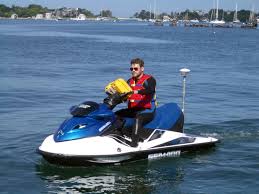
This portion of the USGS data release presents bathymetry data collected during surveys performed in the Columbia River littoral cell, Washington and Oregon, in 2021 (USGS Field Activity Number 2021-632-FA). Bathymetry data were collected using four personal watercraft (PWCs) equipped with single-beam sonar systems and global navigation satellite system (GNSS) receivers. |
Andrew Stevens |
| Beach topography of the Columbia River littoral cell, Washington and Oregon, 2021 |
Radio (base) |
This portion of the USGS data release presents topography data collected during surveys performed in the Columbia River littoral cell, Washington and Oregon, in 2021 (USGS Field Activity Number 2021-632-FA). Topographic profiles were collected by walking along survey lines with global navigation satellite system (GNSS) receivers mounted on backpacks. |
|